Austrian Universities kpi analysis & ewr report
An interactive Power BI dashboard. It benchmarks three major universities through various KPIs and detects early warning signals for financial stability.
Overview
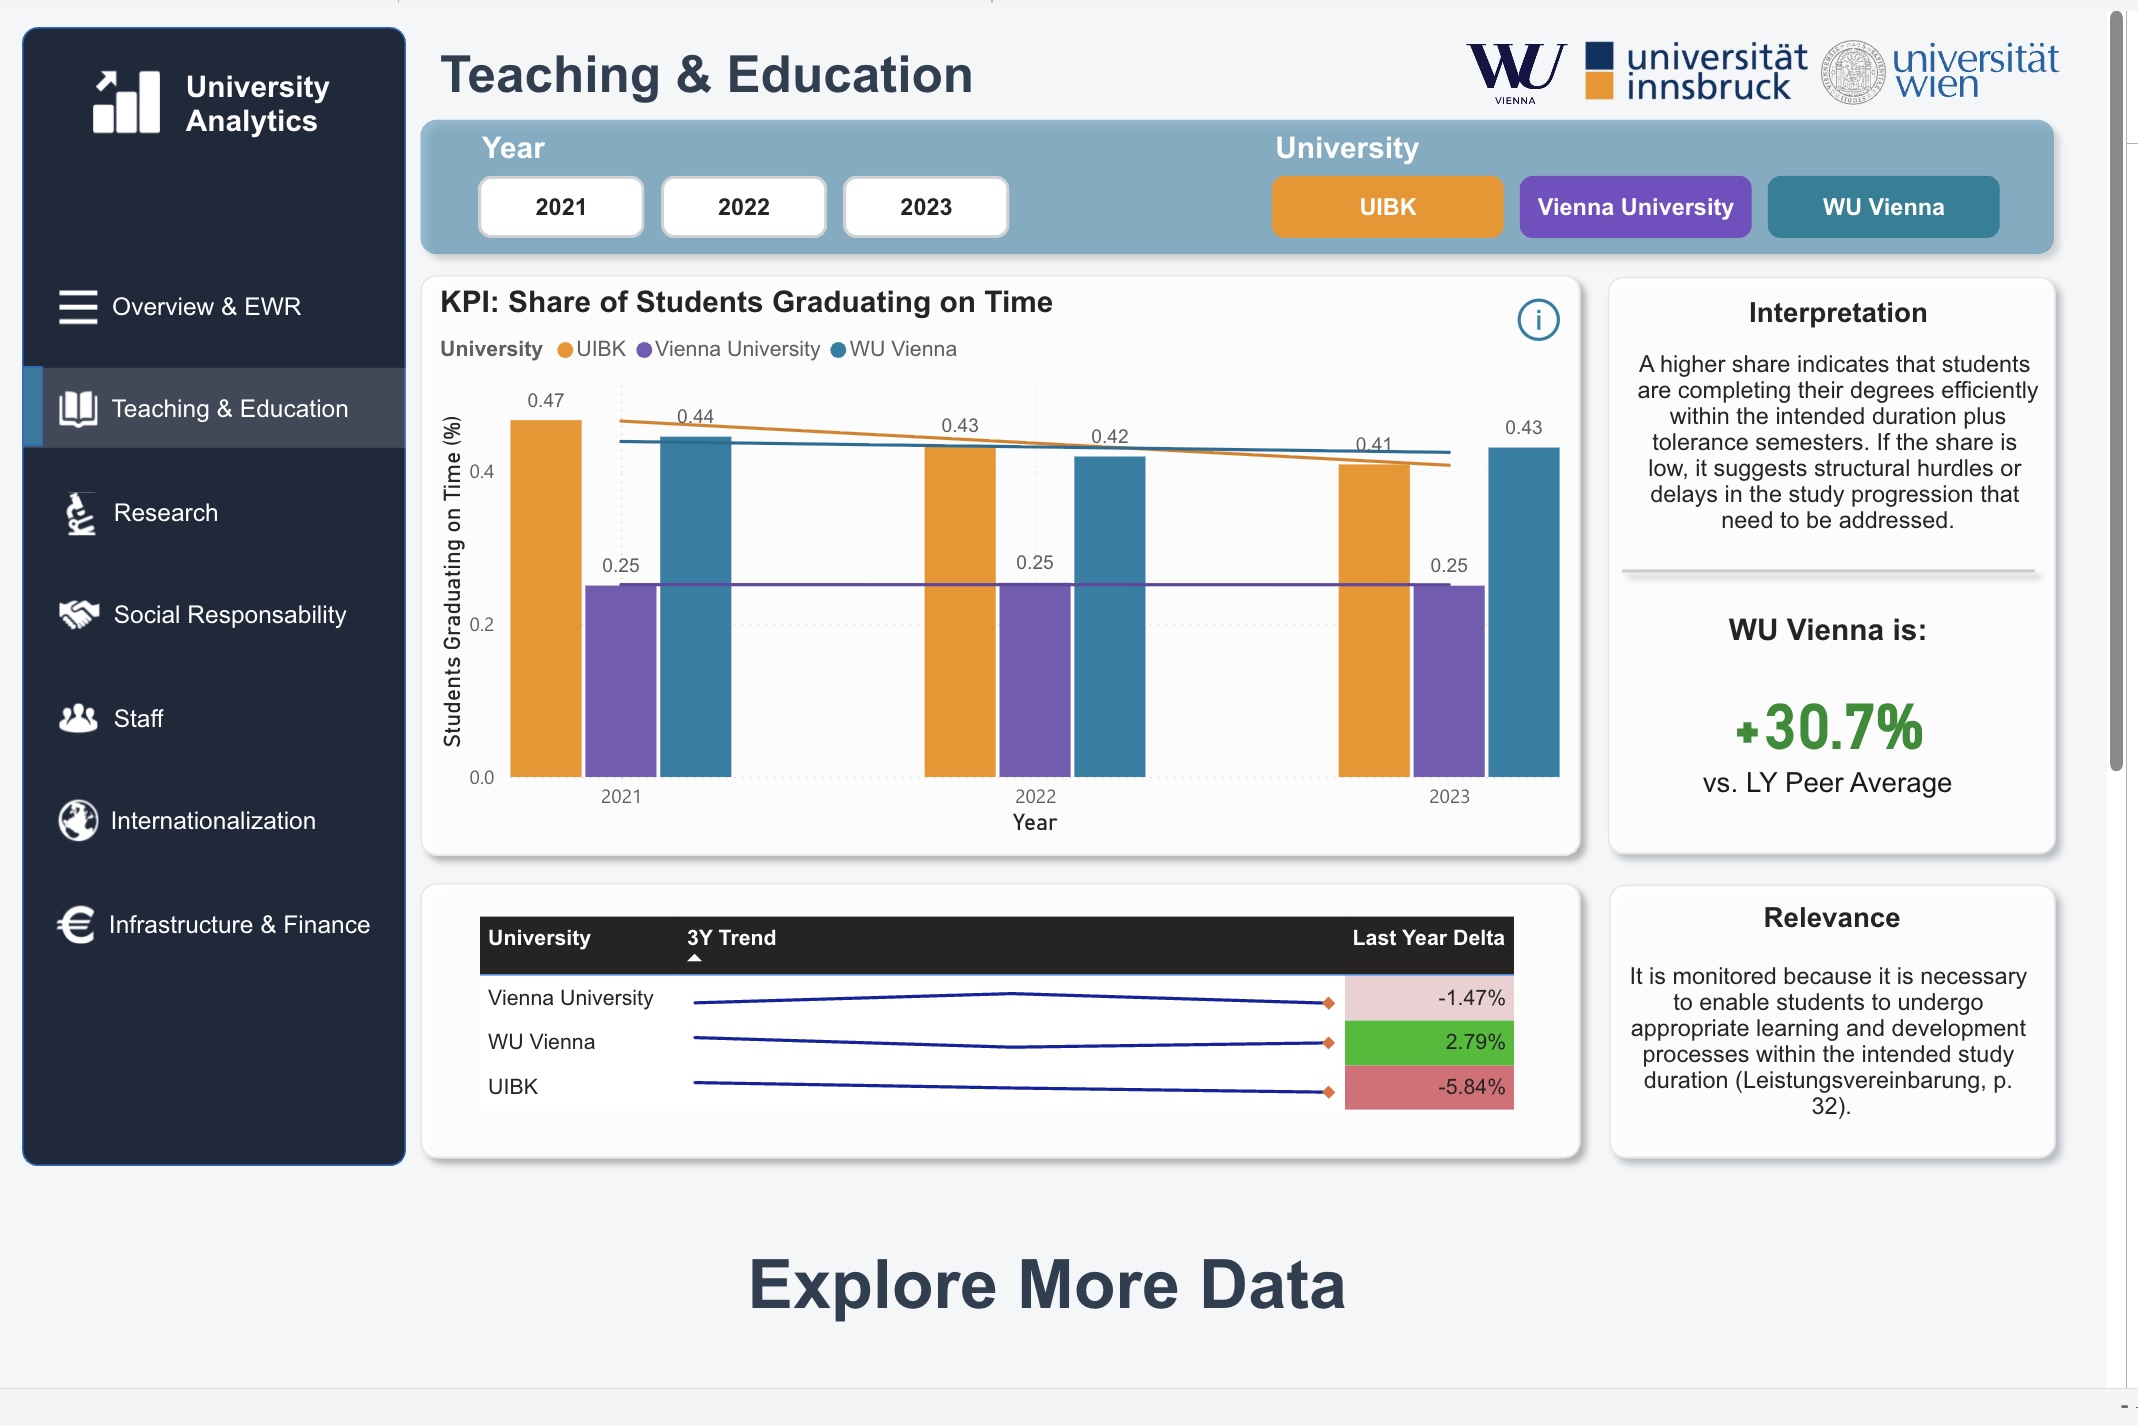
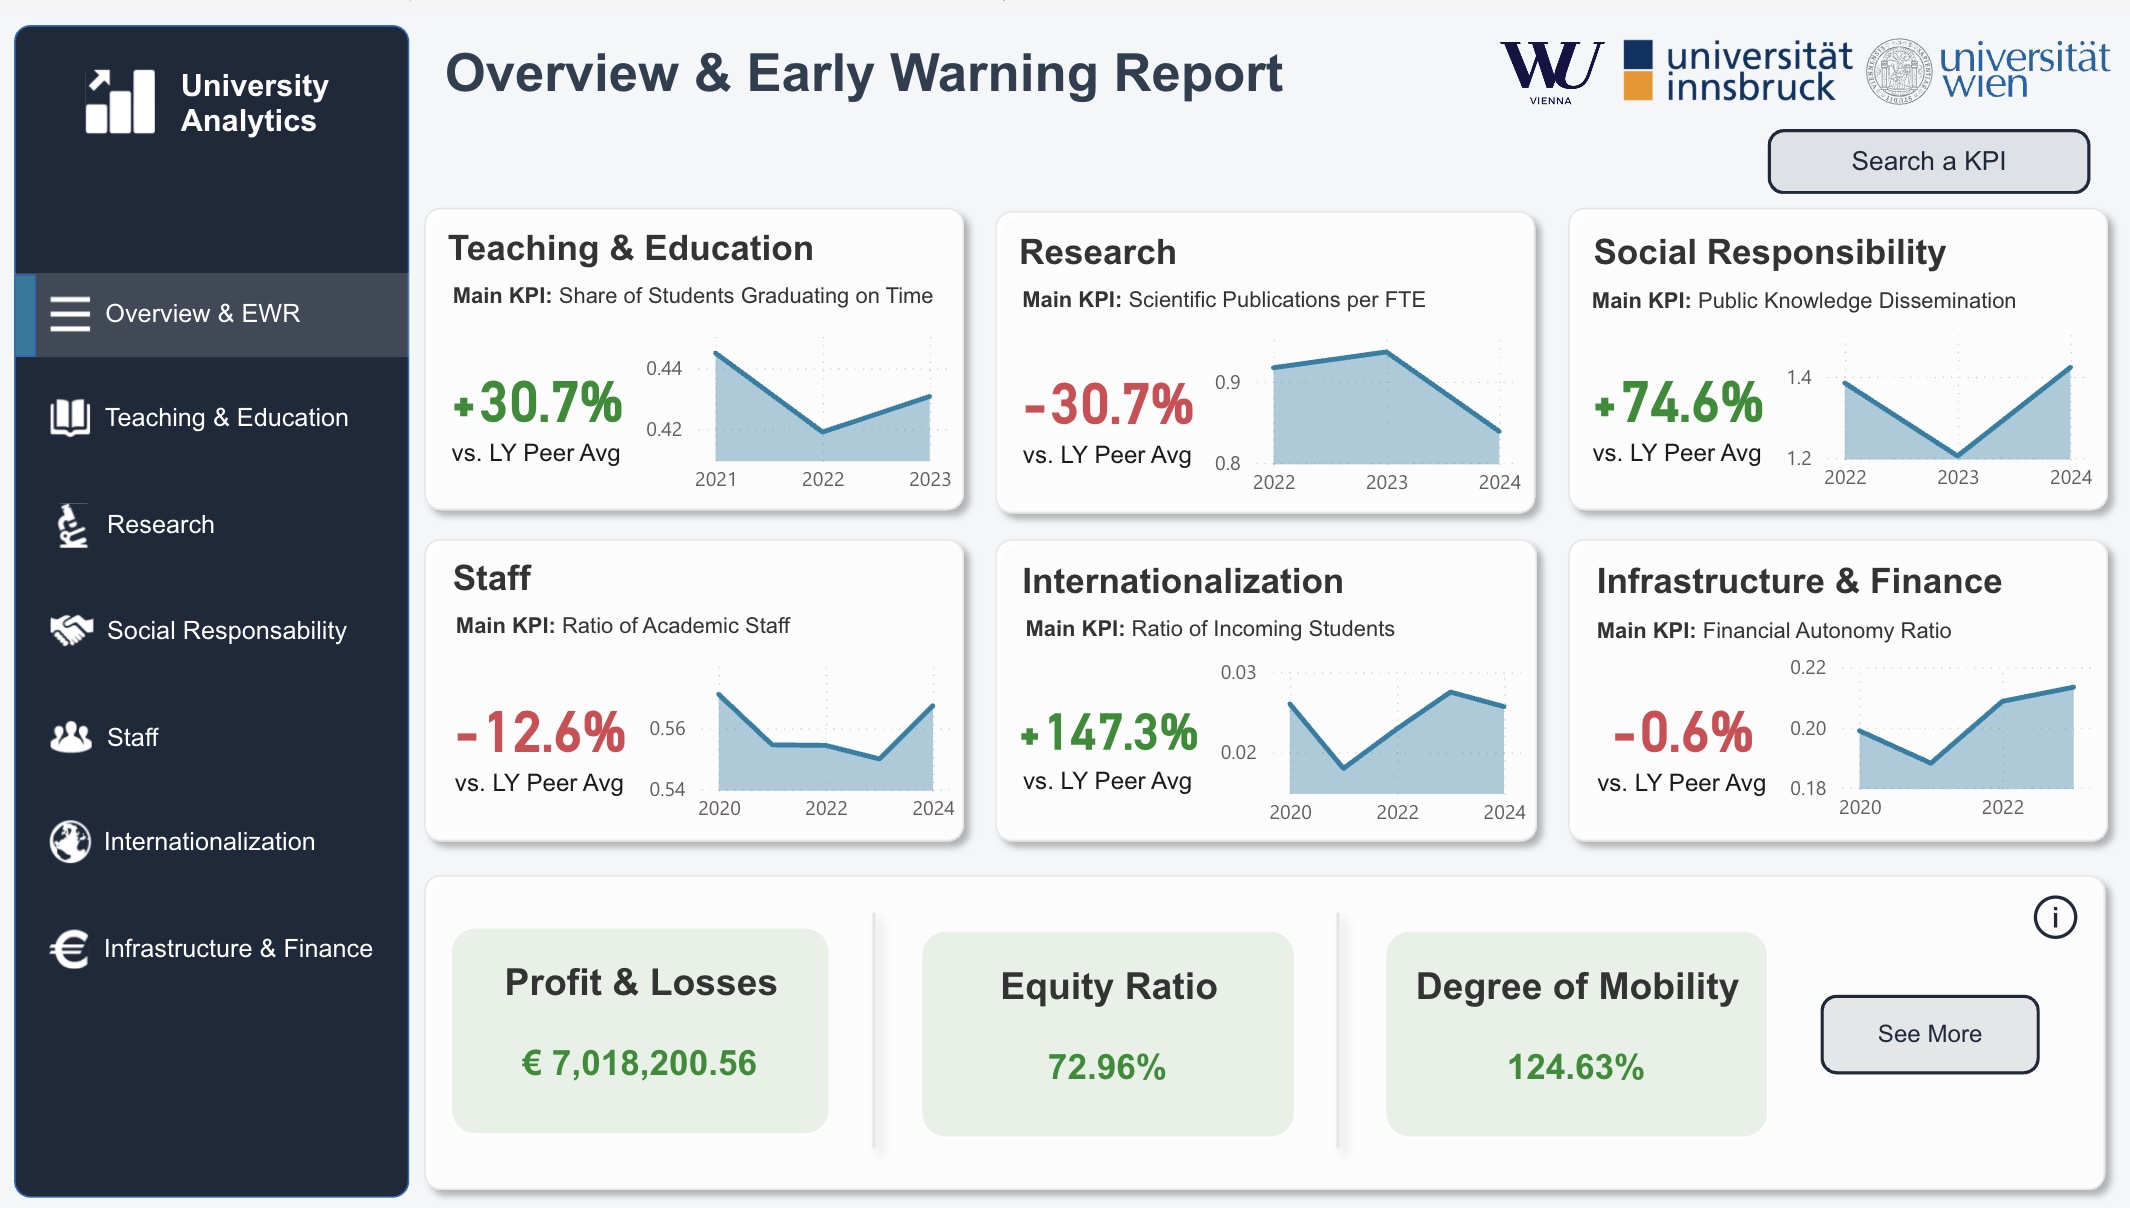
Austrian Universities KPI & EWR Report is a strategic intelligence tool developed to transform static university data into actionable insights. It benchmarks performance across three major institutions (UIBK, WU Vienna, Vienna University) to support decision-making in compliance with federal funding requirements (New Public Management). The project consolidated fragmented Excel datasets into a robust Power BI model, enabling real-time tracking of 30+ KPIs across Teaching, Research, and Finance. It bridges the gap between raw administrative data and strategic management
Role: Data Analyst & Dashboard Designer
Year: 2026
The challenge
University management relies on strict reporting standards to secure government funding
Steps
Strategy & KPI Definition
Defined 6 strategic dimensions (e.g., Research, Social Responsibility) and selected 30 critical KPIs aligned with federal performance agreements.
Data Architecture (ETL)
Transformed fragmented tables into a Star Schema. Used Power Query M-code to remove non-contiguous noise rows and standardize the dataset.
Advanced Modeling (DAX)
Built the system’s “brain” using complex DAX measures (REMOVEFILTERS, Time Intelligence) to calculate Peer Comparisons and YoY Growth.
UX & Interactivity
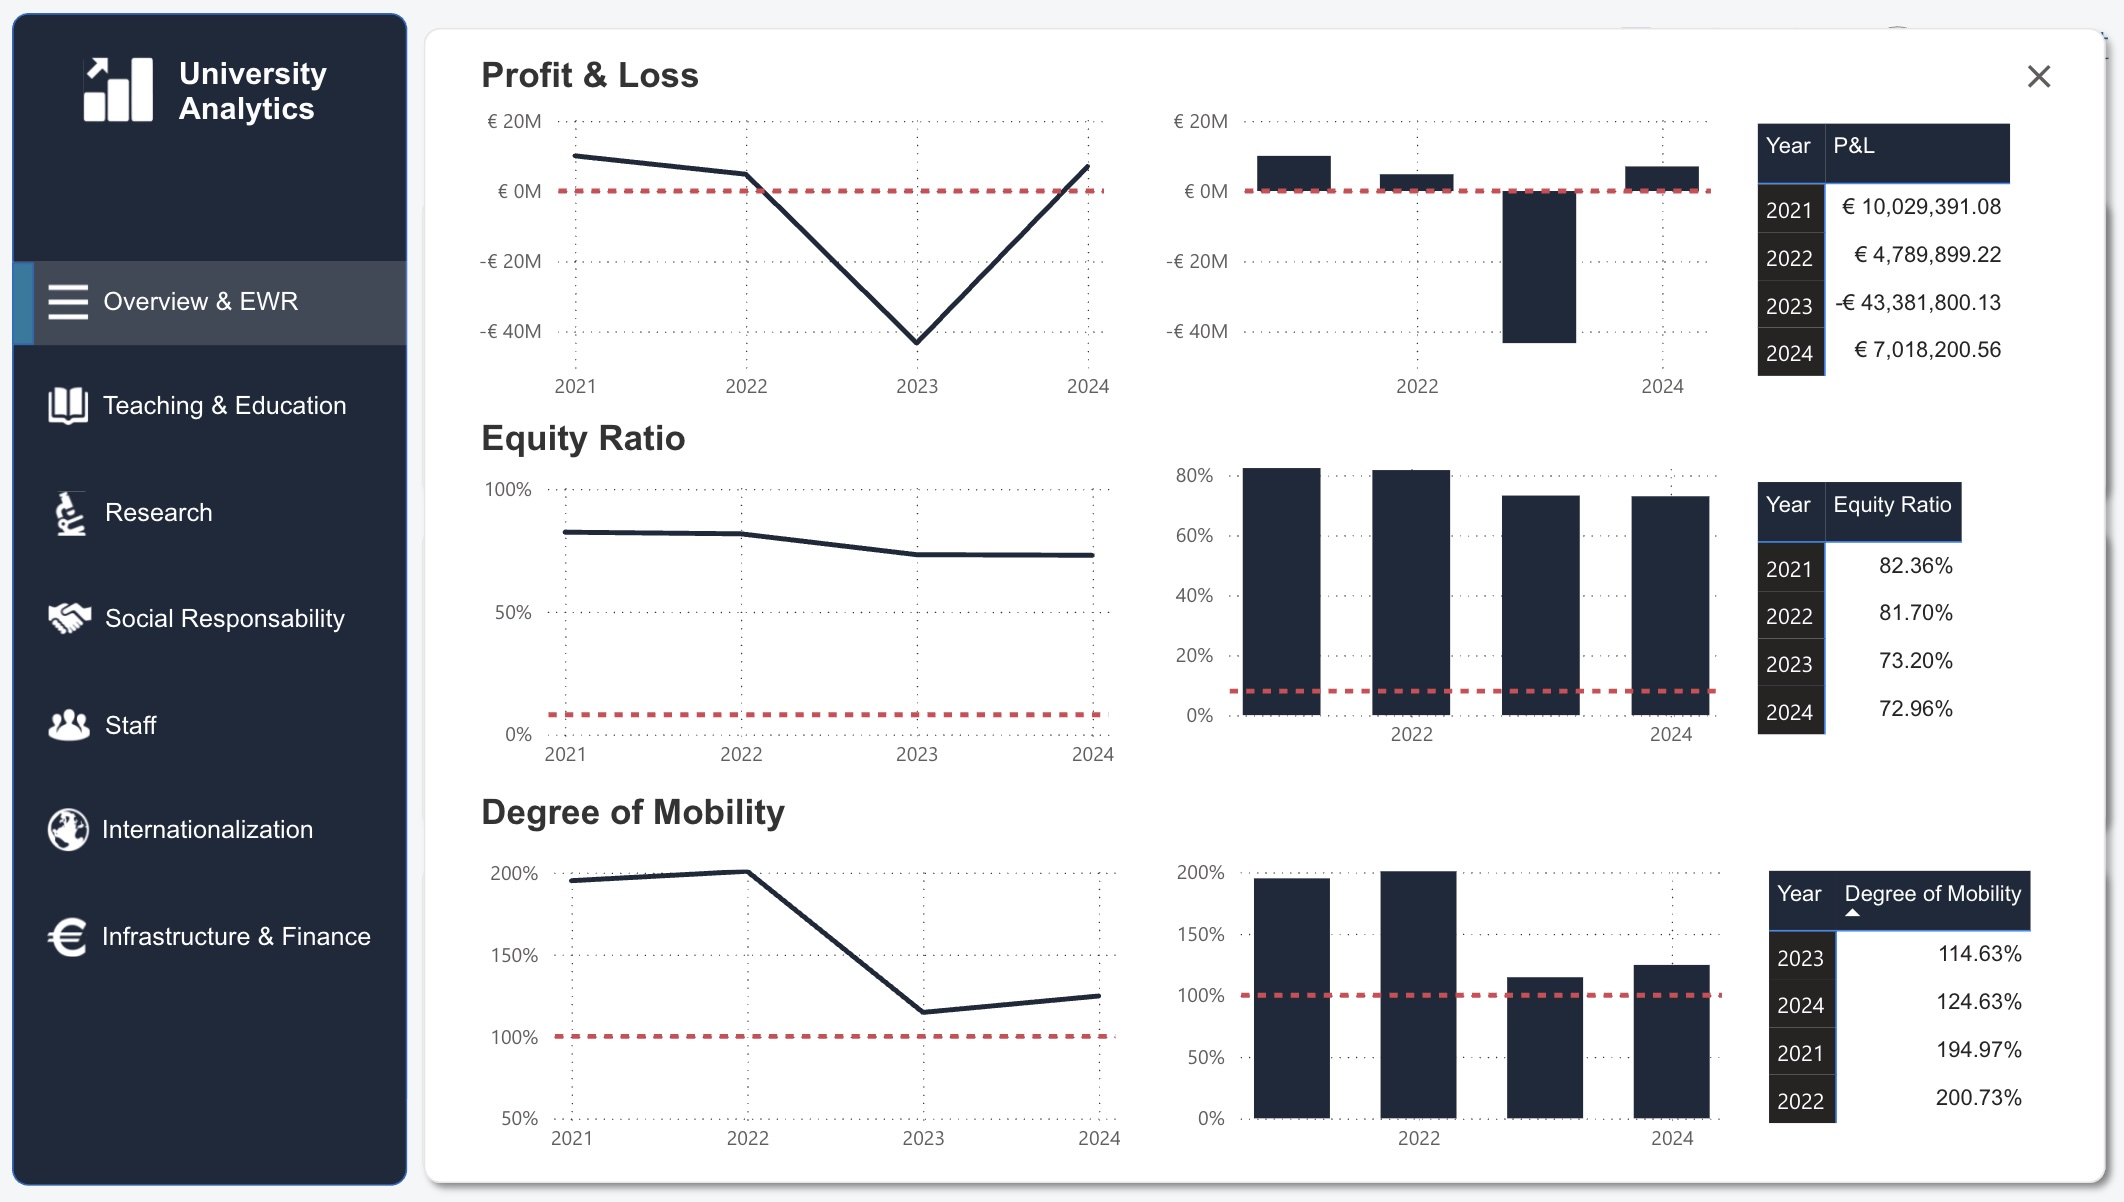
Designed an app-like experience with a fixed sidebar, bookmark-driven pop-up panes, and drill-through logic for deep analysis.
Infrastructure & Security
Deployed the environment on Mac M1 via virtualization and configured Shareable Cloud Connections (OAuth2) to enable secure team collaboration.
results
The project successfully centralized university data into a single source of truth, replacing manual reporting with automated insights
Core Features
-
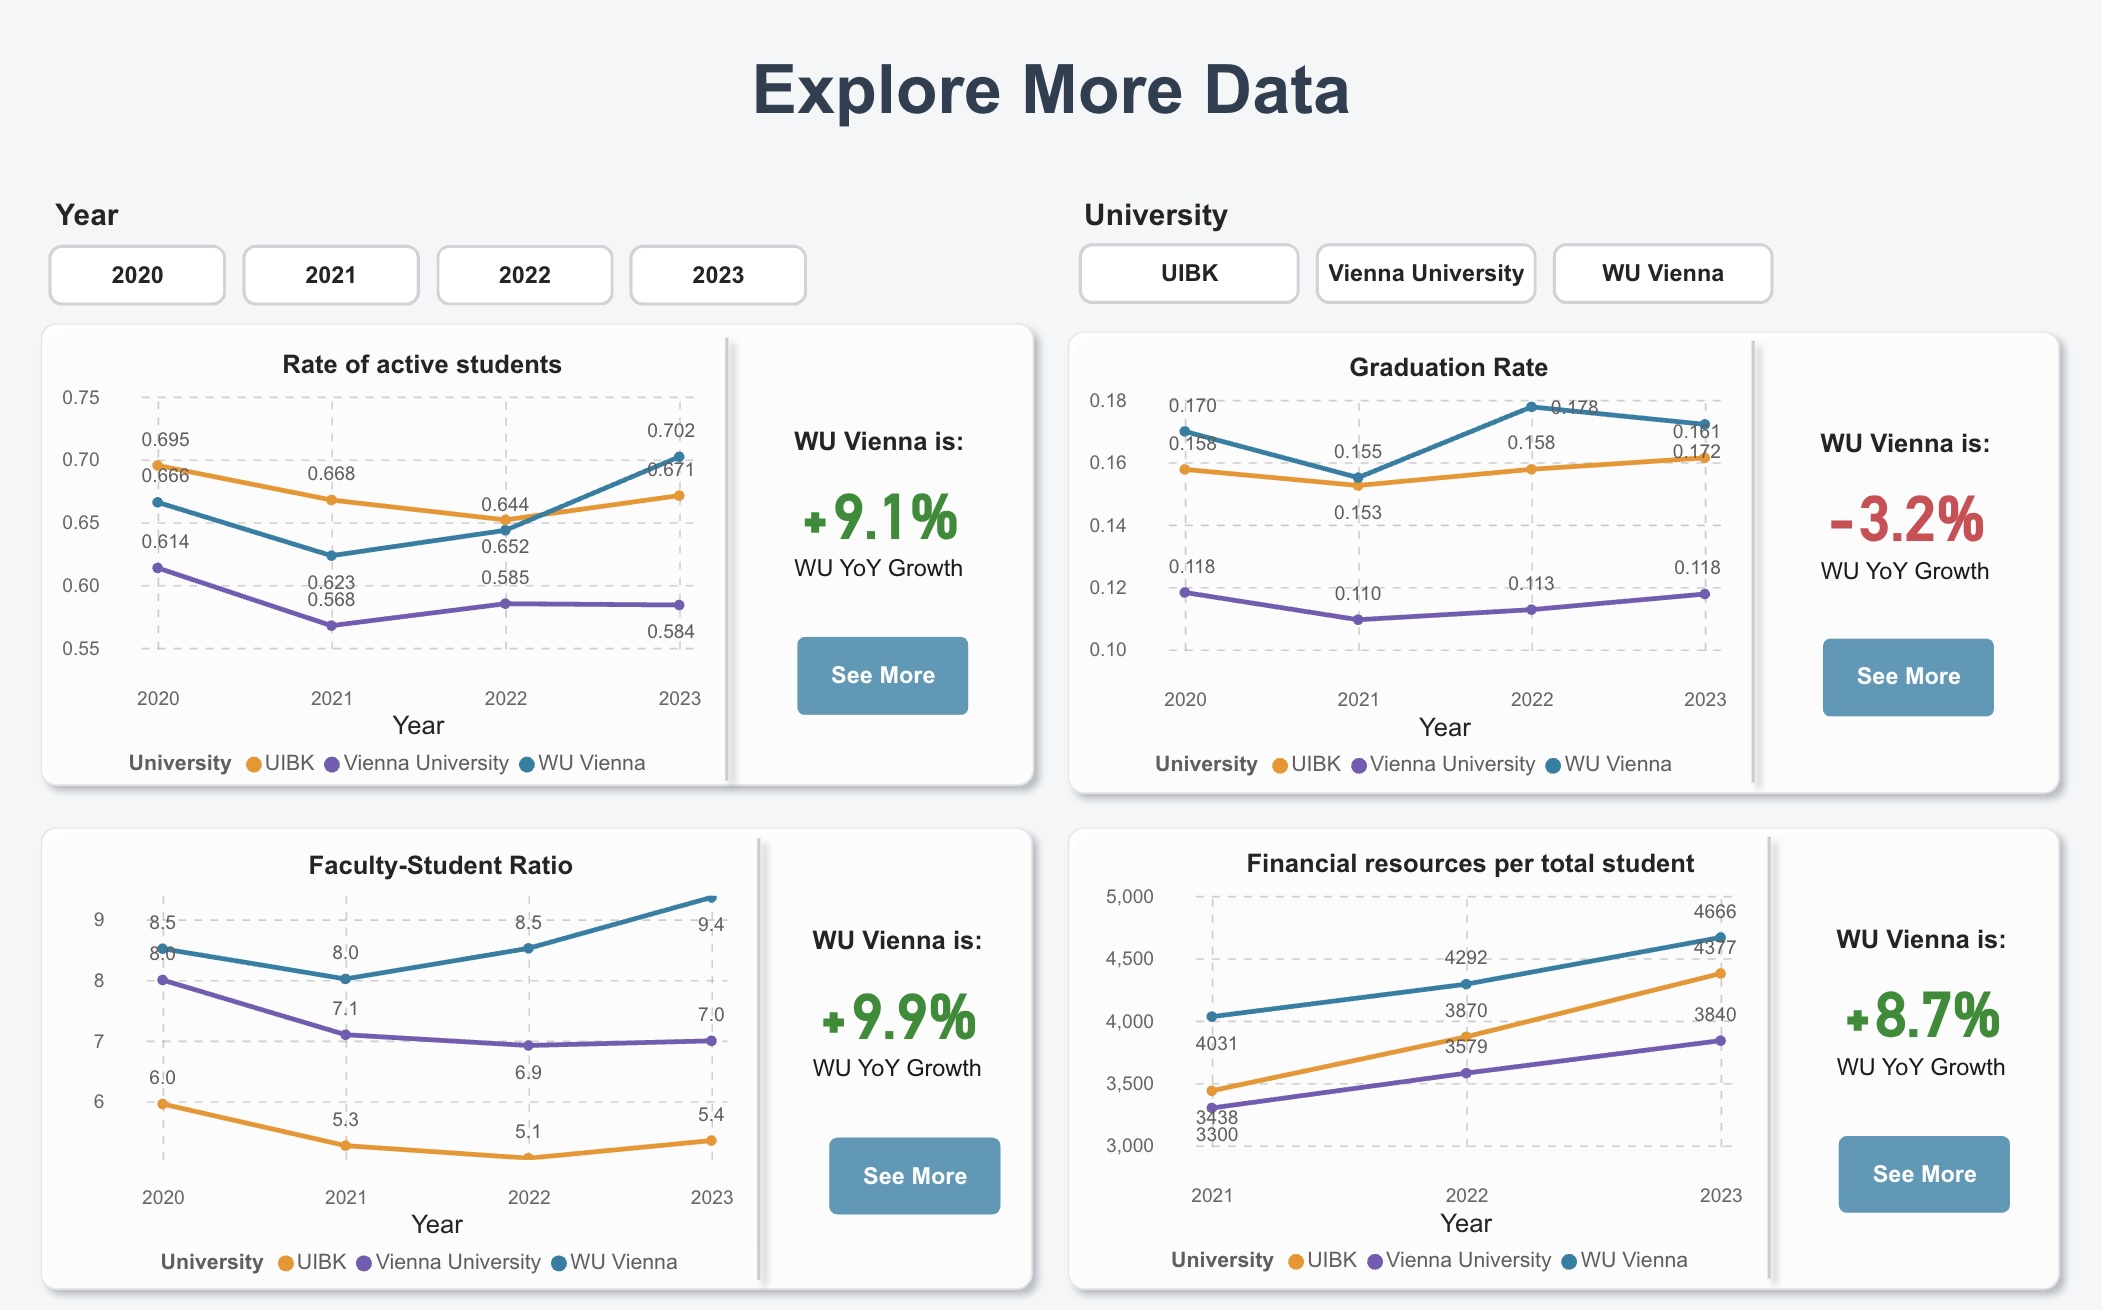
Dynamic Peer Benchmarking (DAX): Custom DAX measures utilize
CALCULATEandALLfunctions to dynamically compare the target university’s performance against the calculated average of peer institutions. -
Time-Intelligence Engine: Implements advanced logic using
REMOVEFILTERSto “look back in time,” enabling automated Year-over-Year (YoY) growth calculations without manual data restructuring. -
Smart Context Integration: A robust 1-to-many relationship links the quantitative master table to a qualitative “WP4” dataset, ensuring definitions and strategic context update instantly upon interaction.
-
App-Like Navigation & Drill-Through: Replaces static report pages with a fixed sidebar and bookmark-driven pop-up panes, allowing users to “drill through” from high-level summaries to granular detail pages.
-
Programmatic KPI Flagging: Utilizes a custom
isMaincolumn flag within the standardized dataset to programmatically identify and project “Headline KPIs” onto executive overview dashboards.